On November 28, 2023, just five weeks shy of his hundredth birthday, the world said goodbye to famed investor Charlie Munger. His homespun, midwestern wisdom was something to be admired; we believe the quote chosen for this quarter’s newsletter, shown above, bears repeating. As trusted stewards of your capital, we do our best to follow Charlie’s wisdom.
This Christmas, Santa’s Route Included a Stop on Wall Street
At year end, the stock market rallied sharply and bond market performance was nothing short of breathtaking. The 10-year Treasury yielded nearly 5% in mid-October and rallied incredibly into year end, driving the benchmark yield below 4%.
As it became clear that the Fed’s tightening campaign had ended, the Wall Street buying spree surged. Despite having lost value in October, the Bloomberg U.S. Aggregate Bond Index, our favored barometer for bonds, had its strongest quarterly performance in more than 34 years. This strong push in November and December ended the long stretch of losses that fixed-income investors have endured since 2021.
The equity market also noted the Fed’s comments as investors piled back into equities and the S&P 500 finished the year up more than 26%. Much of this appreciation was relegated to the Magnificent Seven, a cohort of technology issues (Alphabet, Amazon, Apple, Meta Platforms, Microsoft, Nvidia, and Tesla) exposed to the generative AI revolution.
Meanwhile, reversals in the bond and currency markets drove losses in commodity trading advisors (CTAs) for the period, as CTAs had been both long the U.S. Dollar and short bonds. Recall our CTA managers are bi-directional and generally focus on recent trends, so reversals can prove costly.
FIGURE 1

Source: eVestments
What a Long, Strange Trip It’s Been
For the last three years, we’ve found ourselves in an atypical market driven by unprecedented forces.
First, Americans experienced rapidly rising inflation driven by a combination of rolling COVID restrictions (which prompted pandemic-related government largess) and monetary easing meant to keep the economy from falling into the abyss. In turn, these forces led to shifting consumer preferences—and radically lowered spending habits—as people stopped dining out and travelling.
Then, spending suddenly pivoted as Americans moved to remote work models, setting off a massive wave of home renovations in conjunction with a migration away from city centers and toward suburban locales. This change spurred a boom in commodity prices as consumers began to purchase goods for their homes.
The trend reversed again as COVID restrictions were dropped and consumers embarked on revenge spending sprees to make up for lost time, causing a boom in the travel and leisure industry.
All of this shifting back and forth wrought havoc on supply chains. In the airline industry, for example, commercial pilots were furloughed and pushed into early retirement during the pandemic, which created a pilot shortage a few quarters later. At the same time, previously unimaginable shortages of products such as toilet paper and bleach were experienced by nearly every American household.
Ultimately, this situation spurred the Federal Reserve to act. After first taking the stance that rising inflation was “transitory,” the Fed eventually decided to tighten monetary policy. Not since the early 1980s had such a rapid rise in rates been experienced in the U.S. Eventually, the Consumer Price Index retracted, dropping from its peak of 9% in summer 2022 to its current rate of about 3%.
After much handwringing, the Fed now seems to have declared, “Mission accomplished.” Only time will tell whether Federal Reserve Chairman Jerome “Jay” Powell will go down in history as either the next Arthur F. Burns or the next Paul A. Volcker (Federal Reserve Chairmans, 1970-1978 and 1979-1987, respectively).
Analyzing Interest Rate Regimes
A new regime in interest rates appears to have arrived.
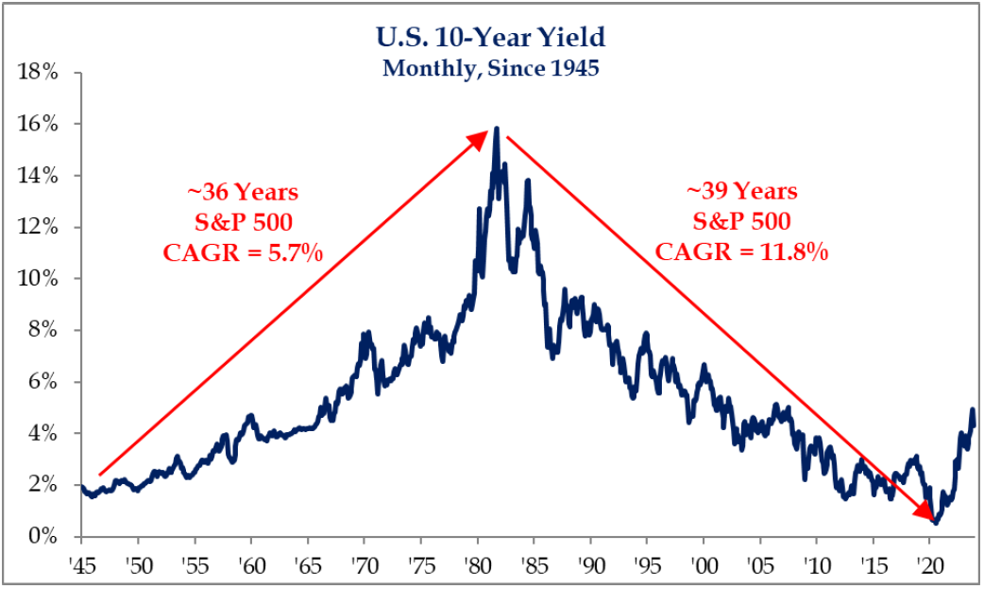
Since 1945, there have been two distinct rate regimes in the United States. As shown in Figure 2, below, the first, a “rising rate” regime spanning 36 years, coincided with a strong period of growth in our nation post-WWII. Contributing to that growth were two significant happenings: America helped rebuild Europe and Japan, triggering economic benefits for our nation, and the largest generation in U.S. history was born. Today, the effects of the Baby Boom generation continue to resonate.
FIGURE 2

Source: Strategas Securities LLC
Following the oil shocks of the ‘70s and the breaking of double-digit inflation by then Fed Chairman Paul A. Volcker, a “falling rate” regime began in 1981, kicking off a multi-decade drop in interest rates. The declining cost of capital combined with massive gains in labor productivity (due to technological advancements) resulted in sweeping wealth creation. This regime ended in 2020 as yields on the 10-year Treasury bottomed at nearly 0.60%.
What’s intriguing about the chart in Figure 2 is how differently equities, as measured by the S&P 500, performed under each period, returning a modest 5.7% in the rising rate period and 11.8% in the falling rate period (more than twice the rate of return). Not surprisingly, low and falling rate environments result in better performance for long duration assets (such as equities) while high and rising rate environments create a more difficult setting for returns.
FIGURE 3

Source: Strategas Securities LLC
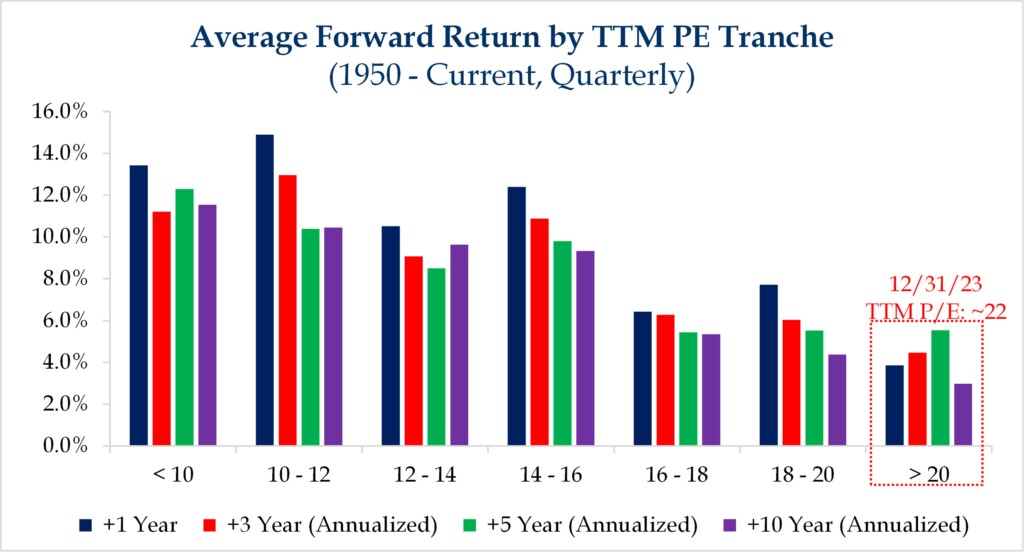
Another key factor in future equity market performance is valuation. A common method for expressing the value of equities is the Price-to-Earnings (P/E) ratio, a stock valuation metric that compares a company’s share price to its earnings per share. The P/E ratio is calculated by dividing the market value price per share by a company’s earnings per share.
Figure 3, above, sorts the equity market into discrete P/E regimes and depicts the subsequent, annualized returns over one-, three-, five- and ten-year periods. This chart clearly shows the strong, positive correlation between the lower earnings multiple an investor pays and what future returns will be. In other words, the less one pays at the time of initial investment, the greater the forward returns. Today, at approximately 22 times earnings, the S&P is on the upper boundary of this valuation spectrum. Historically, investing at such levels results in lower future returns.
Understanding this, we believe that investing in equities today will likely result in lower returns than in the recent past. To put this in perspective, over the last decade the S&P 500 has annualized at 12.03%. Due to several factors (including current valuations and interest rates), our internal market return forecast over the next 10 years for U.S. large cap equities is 7.4%, a number that’s significantly lower than the percentage rate habituated by investors.
2024: A Presidential Election Year
The turning of the calendar brings with it an election year. While politics is never our focus, the potential impact of an election on economic markets will always concern us.
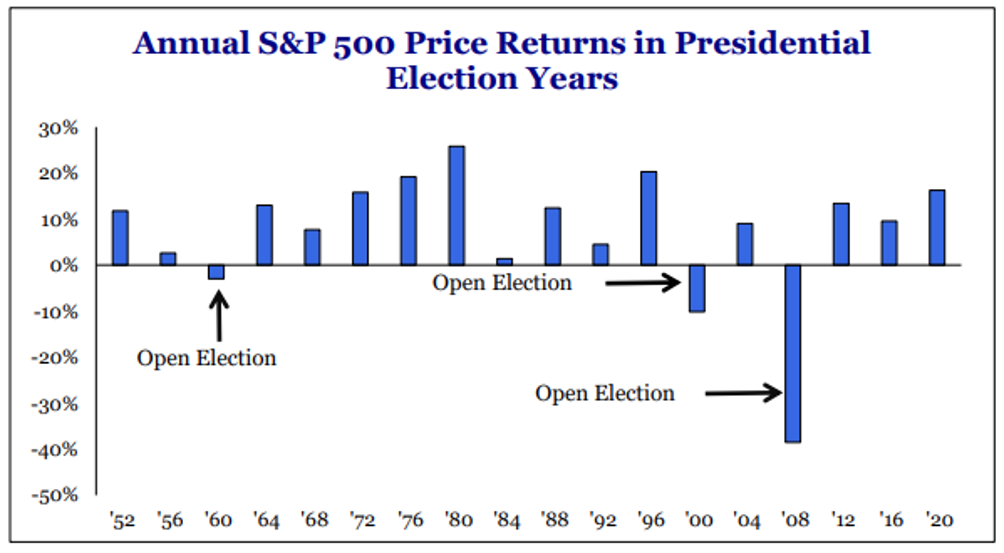
Since 1952, the S&P 500 hasn’t suffered a losing year when a current president has sought re-election. Interestingly, the down years noted in Figure 4, below, occurred during years when an incumbent had reached his term limit and was no longer eligible to run, creating an open election. This makes sense as campaigning presidents want to win and will enact policies designed to keep the economy healthy as voters return to the ballot box. In fact, historical data shows that any president who suffered a recession within two years of a re-election bid ultimately lost that contest! Will 2024 be a positive year for equities? We can’t be certain, but few indicators have been so reliably accurate for 68 consecutive years.
FIGURE 4

Source: Strategas Securities LLC
Our Current Tactical Positioning
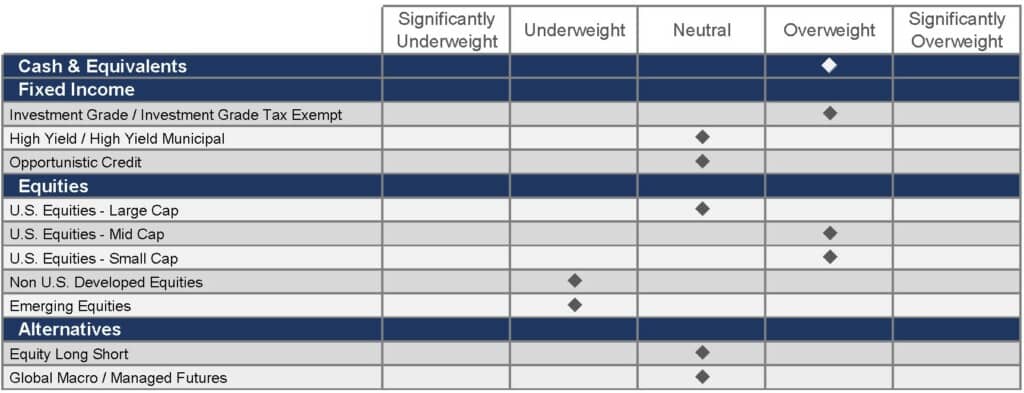
This quarter, we’ve spent considerable time discussing U.S. equities; our neutral sentiments on that topic may not be surprising. Our persistent underweight in international equities, however, may bear further justification.
While international valuations are significantly lower than domestic estimations, we’re keenly aware of the slowdown underway in China. Over the past 20 years, China has been the world’s growth engine. As we’ve discussed in prior letters, China is falling victim to several negative circumstances simultaneously: a demographic collapse, a property meltdown, an insolvent banking system, and a political regime that seems to have lost touch with reality.
Readers of our newsletter know there is value in using history as a reference point. To that end, several parallels can be drawn between 2024 China and 1990 Japan. Following the burst of Japan’s real estate and asset bubble in the early ‘90s, the Japanese economy experienced two decades of stagnant growth and deflation. At the time, Japan appeared to be closing in on the U.S. economy, just as China had been threatening to.
Presently, Chinese exports to the U.S. continue to fall, and the country’s youth unemployment statistics are so untenable its leaders have stopped publishing them. Given the size of the Chinese economy—second in the world—this slowdown will have global impacts.
FIGURE 5

Source: FineMark National Bank & Trust
Note: These are our current, broad views on the major asset classes employed in family allocations. Due to the high degree of customization FineMark provides, these views won’t be uniformly expressed in every portfolio.
Happy New Year
A new year is always full of promise and hope, and we look forward to sharing these sentiments with you in person. Many of our offices have planned events throughout the year, and we encourage you to join us. At FineMark, we remain focused on providing superior service and guidance to you, our clients. Wishing you and your loved ones a prosperous and healthy 2024. We look forward to seeing you soon!
2023 Fourth Quarter Review and Commentary
By Christopher Battifarano, CFA®, CAIA
Executive Vice President & Chief Investment Officer
Articles In This Issue:
2024 Resolutions and COLA Updates
Download 2023 Q4 Newsletter Here
This material is provided for informational purposes only and nothing herein constitutes investment, legal, accounting or tax advice, or a recommendation to buy, sell or hold a security. Information is obtained from sources deemed reliable, but there is no representation or warranty as to its accuracy, completeness or reliability. All information is current as of the date of this material and is subject to change without notice. Any views or opinions expressed may not reflect those of the firm as a whole. FineMark National Bank & Trust services might not be available in all jurisdictions or to all client types.


